Display, Analyze and Download
Accessing Functions
Clicking a feature brings you to the feature info page to access functions such as generating charts and reports...
Accessing Data
The feature info page also allows access to more detailed data (like well tests or bids on a lease)...
View in Map
From any individual feature in GOMsmart, you can view it immediately in the GOMsmart Map by clicking on the View in Map button...
Reports
GOMsmart can generate reports on features using the latest information...
Charts
GOMsmart provides the ability to plot production data...
Decline Curve Analysis
GOMsmart provides the ability to forecast remaining oil and gas by completion....
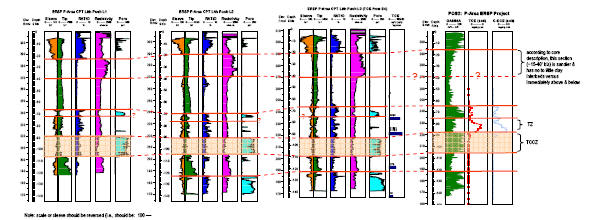
Well Logs
Well logs are detailed record of the geologic formations penetrated by a borehole....
Accessing Functions
After finding your desired feature, clicking on it will expose additional functions to explore the data more deeply or perform analysis. The following functions are available in GOMsmart:
Not all functions are available for every type of feature and some options will also change. The output of reports and decline curves is a .pdf, charts are produced as images, downloading production produces a .csv that can be opened in excel and well logs are available as preview images or the original .tif images.
| 
| |||
|  |
Accessing Data
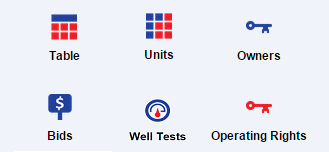
Many features in GOMsmart have too much information to be displayed in a single page. As such, the information is split up and accessed separately. The different categories of more data are:
- Table
- Owners
- Bids
- Remarks
- Operating Rights
- Units
- Well Tests
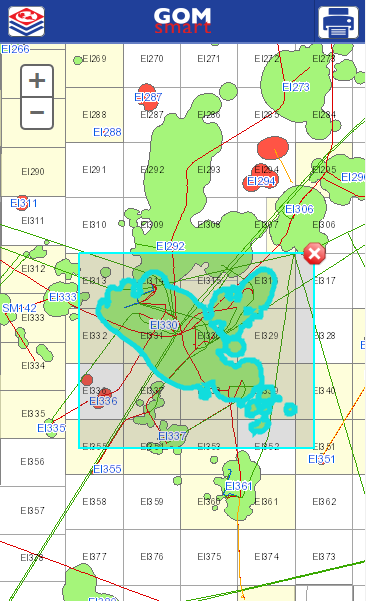
View in Map
From any individual feature in GOMsmart, you can view it immediately in the Smart Map by clicking on the View in Map button.
- Your selected feature will be highlighted in cyan in the map.
- Click the X in the upper right corner of the selection to dismiss the highlighting.
- Click the browser back arrow to return to the feature screen.
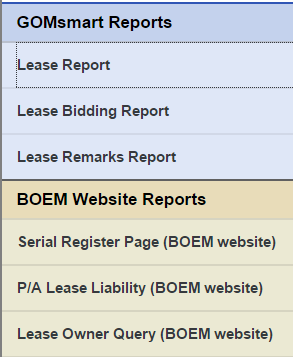
Reports
GOMsmart can generate reports on features using the latest information and output the results in an easy to read .pdf. Reports are accessed through the feature info page. There are multiple reports that can be created for most features and the type of reports change depending on what feature you have selected. GOMsmart also links directly to the BOEM reports on the selected feature to save you the time of navigating through the BOEM website.
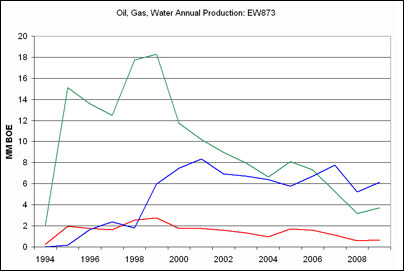
Charts
GOMsmart provides the ability to plot production data over time on leases, fields, wells, completions and platforms. Charts are accessed through the feature info page. You can plot oil/gas or BOE in either total monthly production or production per day (for completions). The x-axis can also be customized to plot over real time, number of months on production or cumulative production. The y-axis can either be a linear or log scale.
If a field was selected, you can also plot the development history and EUR by play.
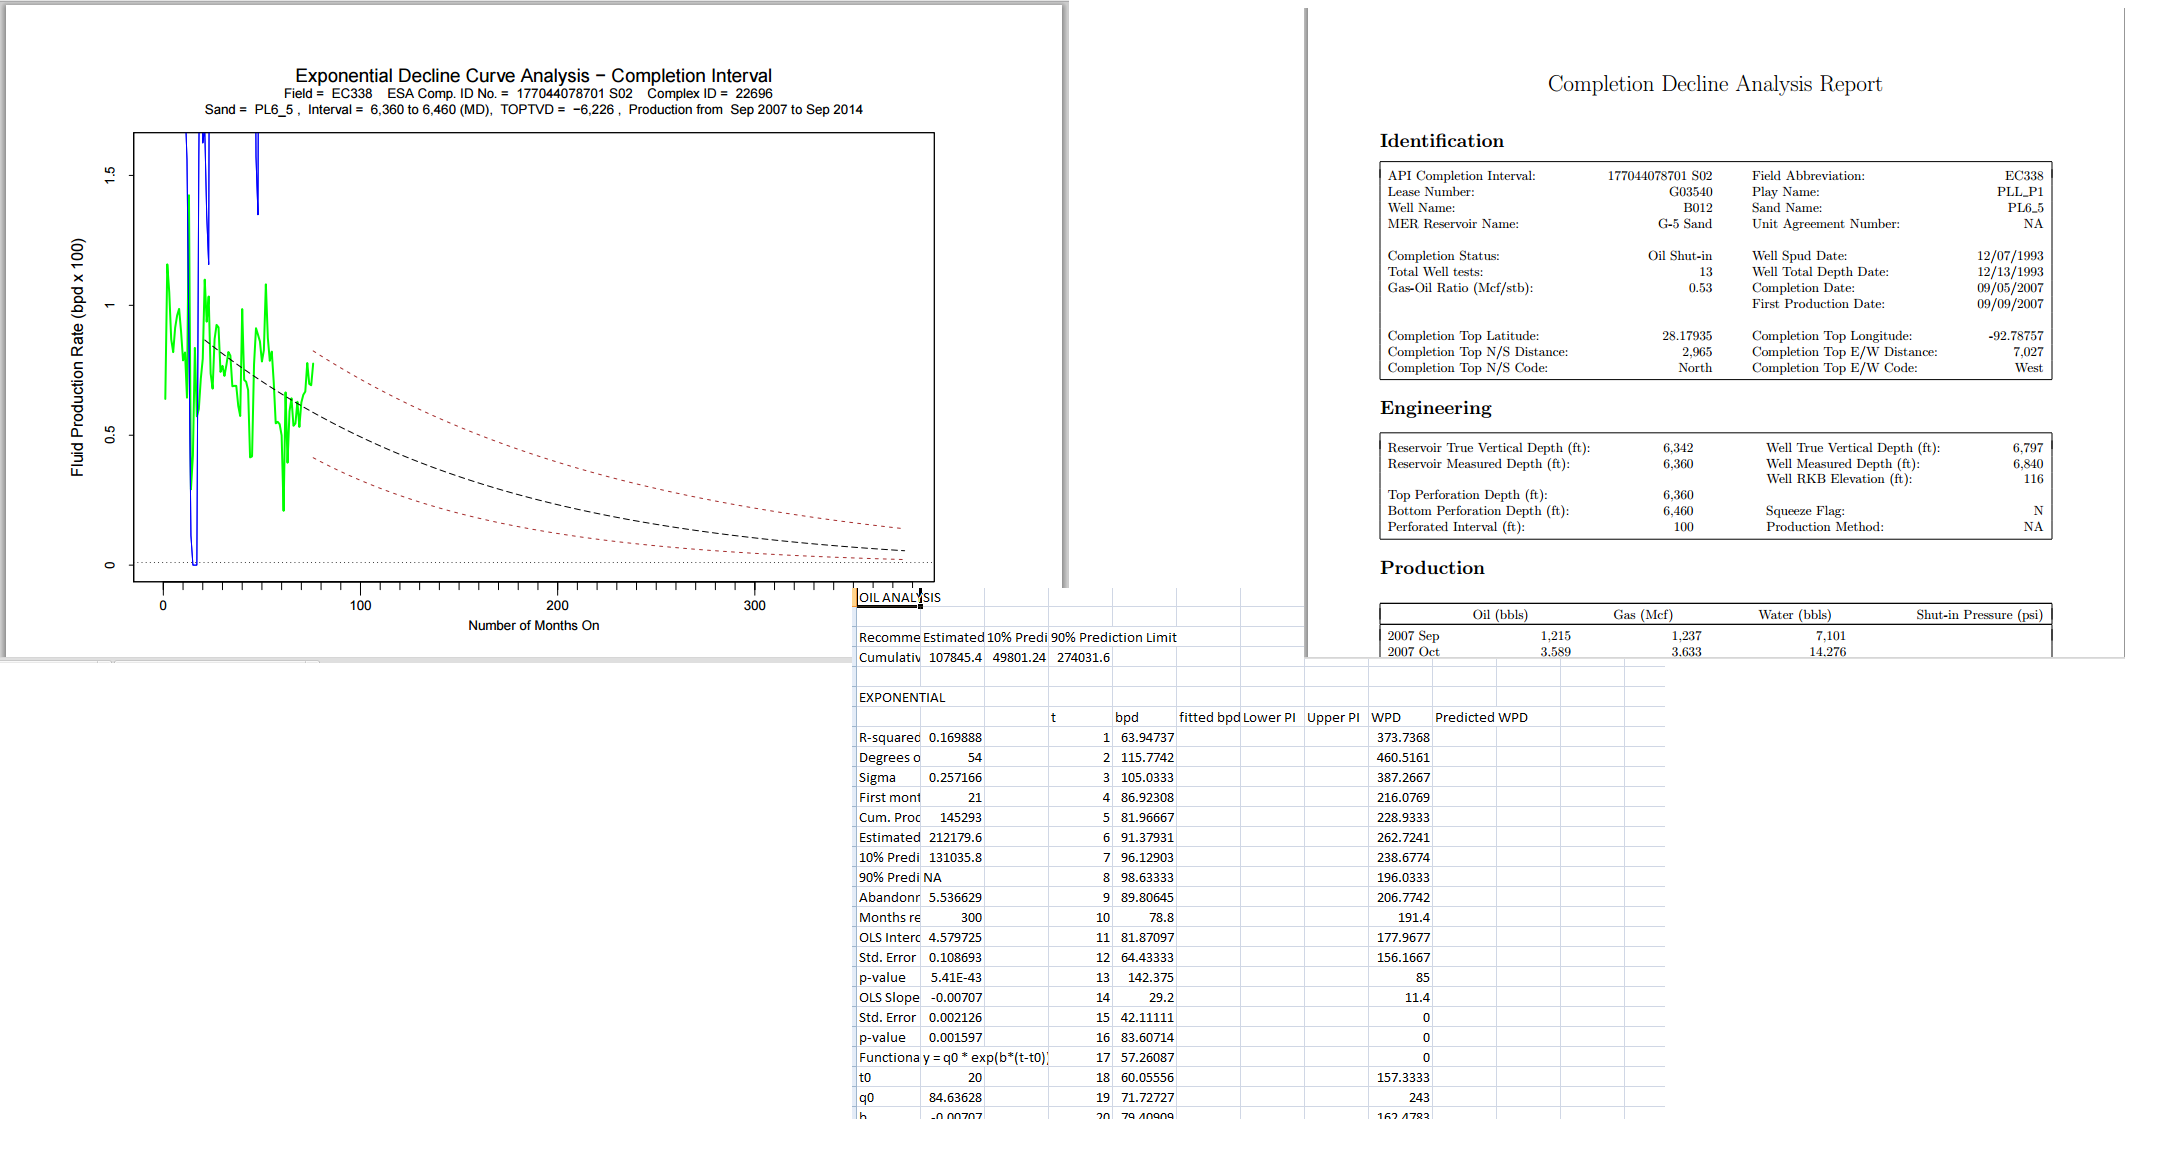
Decline Curve Analysis
GOMsmart provides the ability to forecast remaining oil and gas in completions by fitting decline curves to the production data. Declines curve analysis is a common way to forecast future production rates and to determine the expected ultimate recovery of resources. For a more detailed explanation see Analysis of Decline Curves.
In GOMsmart, decline curve analysis is available from the feature info page under completions only. Using the production data from the selected completion interval, three models are fit (exponential, cumulative and hyperbolic). Since decline curve analysis is only valid once production enters decline, the production data before the max production rate is discarded. Furthermore, decline regimes can change over time so if a new regime is found, all data before that point is discarded. Alternatively you can specify a time to begin the decline curve analysis.
The user must also specify the economic rate limits for oil and gas. This determines the stopping point for the forecast. Additionally the user can specify an economic pressure limit which will be used if sufficient pressure data for that completion is available.
Once all the parameters are set, there are three output options. Charts will create a .pdf with the graphical output for every model displayed as well as some important statistics. Choosing reports generates a .pdf with more detailed information but only the model with the highest R2 is graphed. Finally, Excel creates a .csv file of the results if further analysis is needed.
Well Logs
Well logs are detailed record of the geologic formations penetrated by a borehole. GOMsmart provides the Well logs to be previewed and downloaded. To access the logs,
- Select the "Wells" feature for the block of your choice.
- Select the Well of your choice.
- Select Well logs.
- You can preview the Well log header or part of the log online if the log file is large.
- Download the log file in the TIFF format