Storms
Overview
The National Hurricane Center (NHC) releases information on cyclones that ESA consumes and processes to be viewed in map space...
Disturbances
ESA maps the NHC’s disturbances and color codes them by chance to form into a cyclone over the next 5 days...
Forecast Tracks
Once a cyclone forms, the NHC produces a forecasted track...
Wind Radii
the wind radii represent how far the wind speeds from the cyclone will be felt beyond the center of the cyclone...
Overview
The National Hurricane Center (NHC) releases information on cyclones that ESA consumes and processes to be viewed in map space. To view this data, click on the storms link. There are three types of cyclone related data in the storm map: disturbances, forecast tracks and wind radii. A disturbance is a weather formation that has the potential to form into a cyclone. ESA maps the current location of the disturbance, the location where the disturbance may form into a cyclone, and with sufficient conditions also produces a forecast for the system if it were to form into a cyclone. After a disturbance forms into a cyclone, the NHC produces a forecast track that contains points that are time stamped with maximum wind speeds. Additionally, forecasted wind radii are also mapped which describe the distance from the center where wind speeds of 34/50/64 knots are reached in quadrants. Hotlinking is also enabled on this map to view platform information.
Disturbances
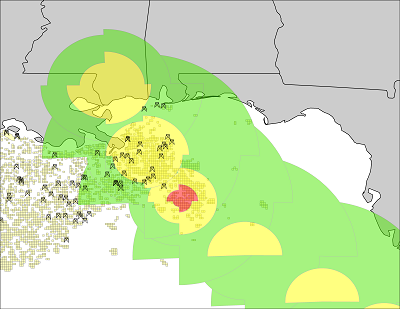
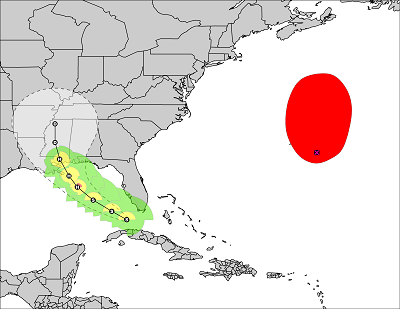
ESA maps the NHC’s disturbances and color codes them by chance to form into a cyclone over the next 5 days (yellow for low, orange for medium and red for high). The disturbance has two components, the current location and the area in which the disturbance will form into a cyclone sometime over the next five days (the origin polygon), if it does at all. The NHC typically updates their disturbances at 2 AM, 8AM, 2 PM and 8 PM EDT and ESA will process the new data shortly after. For more information see 2-Day Graphical Tropical Weather Outlook .
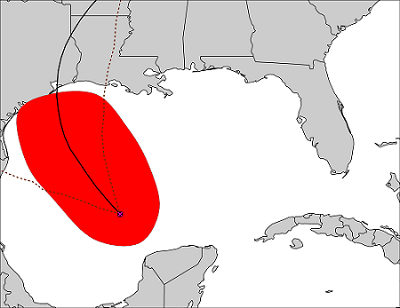
The NHC does not provide a forecasted track for disturbances and will only provide a forecasted track after the disturbance forms into a cyclone. Since there are instances when a forecasted track would be useful before the NHC provides one, ESA has implemented an algorithm to create a forecast with confidence intervals for disturbances that are near the Gulf of Mexico (between 60ºW and 100ºW and 10ºN and 30ºN).
Essentially the algorithm finds which past tracks best match the current disturbance's known track and uses these past tracks to make a forecast on where the disturbance will head next. The forecast begins at the center of the origin polygon since this is the best estimate for where the disturbance will form into a cyclone. The known locations of the disturbance, the current heading of the disturbance, the date of the disturbance, and the translation distance to the origin polygon both horizontally and vertically are the variables used in determining how well the past tracks match the disturbance. This allows an assignment of weights to the past tracks which are then used to make a 72 hour forecast.
Forecast Tracks
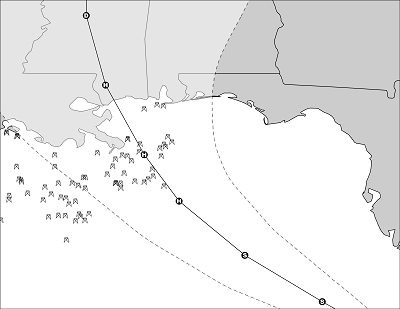
Once a cyclone forms, the NHC produces a forecasted track. This forecast contains points that show the future location of the center of the cyclone as well as the maximum wind speed at that time and location. The forecast also contains a cone which represents the probable track of the center of the cyclone. Note that this cone only gives information on the center of the cyclone and the effects of the cyclone may be felt many miles outside of this cone. For more information visit Definition of the NHC Track Forecast Cone.
Wind Radii
While the forecast track only provides center line information, the wind radii represent how far the wind speeds from the cyclone will be felt beyond the center of the cyclone. The wind radii are broken into quadrants (NE, NW, SE and SW) and three thresholds (34, 50 and 64 knots). For every quadrant the NHC forecasts how far in that direction are wind speeds experienced of at least 34, 50 and 64 knots. The NHC only provides the forecasted wind radii in text form and ESA processes this data and converts them into the shapes shown on the map. For more information see How To Read The Forecast/Advisory .
ESA also uses the information from the wind radii to create a plot of wind speed over time for every platform. This plot can be viewed by hotlinking on a platform.