Using the Main Map
Navigate the Map
Access the map from anywhere in GOMsmart by clicking Menu at the top right of the navigation bar or by clicking on the Smart Map tab...
Access Reports on Map
Tap once on the map and then click the specific /feature you’d like from the drop-down menu...
Add/Remove Map Layers
To change what features are visible on the map, expand the Layers list on the menu at the top left...
Print from the Map
You can print from the map at any time. Expand the Print menu on the left...
Navigate the Map
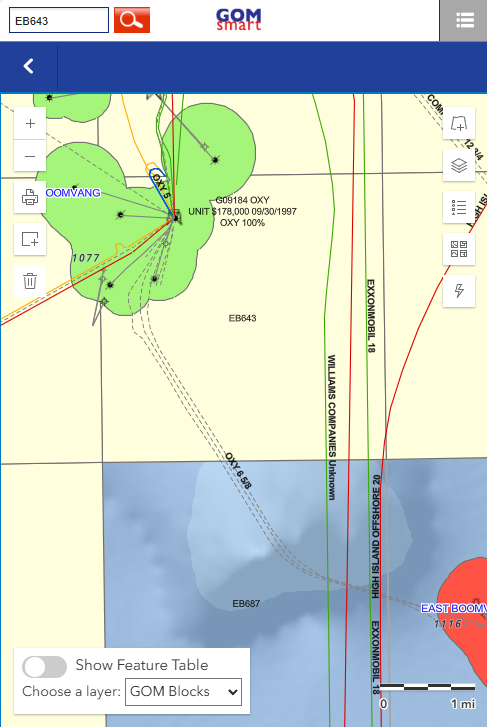
Access the map from anywhere in GOMsmart by clicking the menu at the top right of the navigation bar or by clicking on the Smart Map tab. Navigation on the Smart Map is very similar to other common maps.
- Pan up, down, left, or right by dragging the map.
- Zoom with your mouse's scroll wheel, pinching-in or pinching-out on mobile devices, or pressing the [+] and [-] buttons at the top left.
Access Reports, Charts, Well Logs, Downloads from the Map(Hotlink)
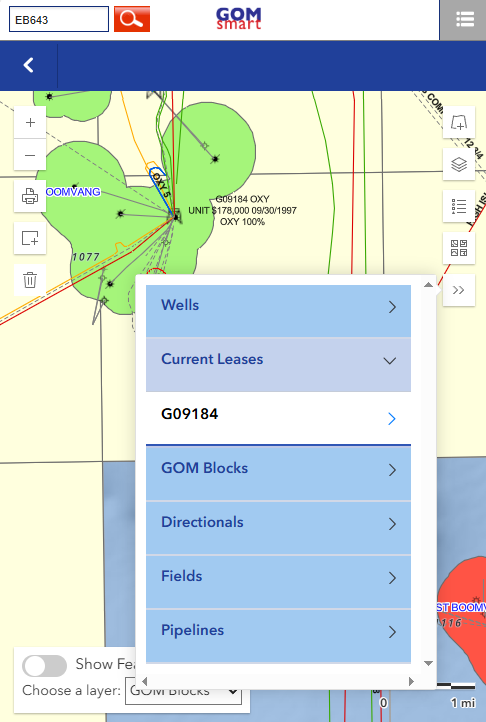
- Tap once on the map near the feature of your choice. This is called a “Hotlink.”
- A list of all nearby features will be created in the Identify section of the menu on the left. Click the specific feature you’d like from the list.
- This brings you to the feature info page where you can choose Reports, Charts, Downloads, Well Logs, etc.
Add Map Layers
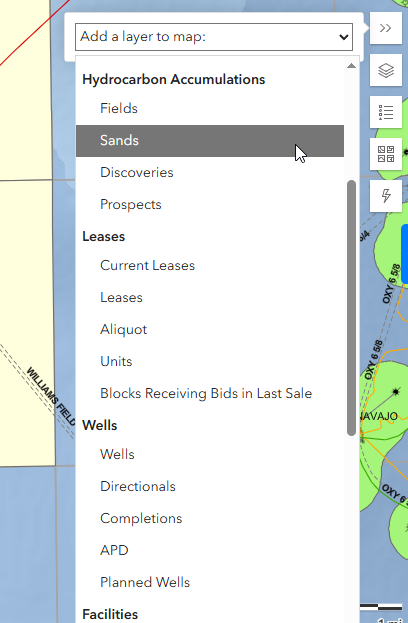
- The map defaults to show platforms, pipelines, wells, directional surveys, fields, blocks, leases, and storm information (when available). Completions, discoveries and prospects are loaded but not visible. All of these layers can be turned off and other layers can be turned on.
- More layers of data can be added from the button on the top right, including sands, planned wells, bathymetry and a series of layers preparing for lease sales.
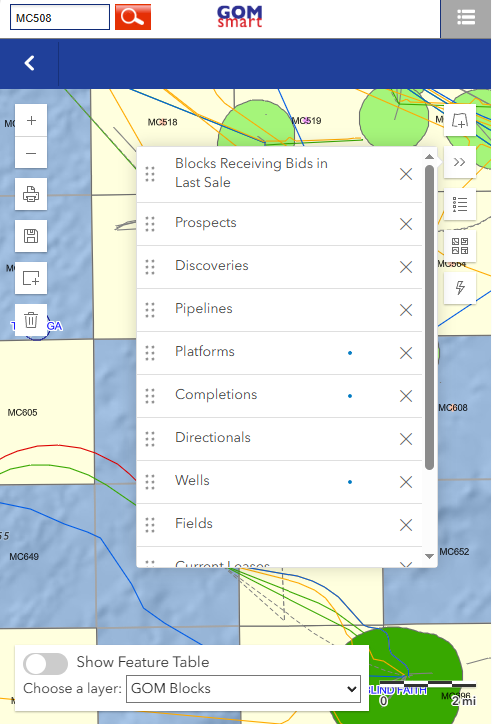
Manage Map Layers
- The next button on the right is the table-of-contents. With the six dots to the left of each layer of data, the layer can be dragged up or down to change the drawing order. On the right side is an eye icon to make each layer visible or not and finally an X on the far right to remove the layer from the map.
- The next button down on the right displays the legend of each layer in the map.
- The fourth button on the right allows changes to the underlying base map (the default is the ocean base map).
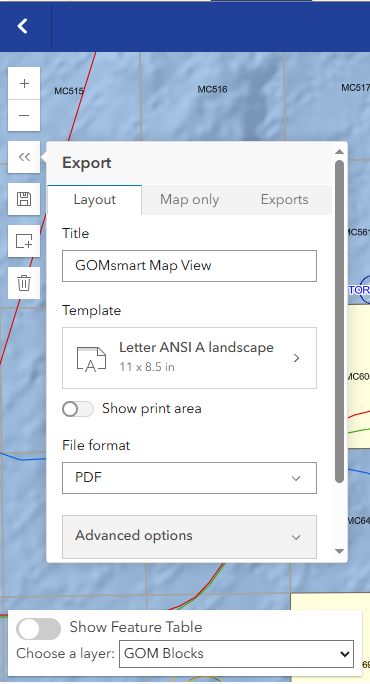
Print the Map
You can print from the map at any time. Click the Print button on the left. Then, choose your size, output type (image or PDF) and change the title and scale if necessary. This will generate a map in a variety of formats, centered on the current view of the map that can be printed and emailed.
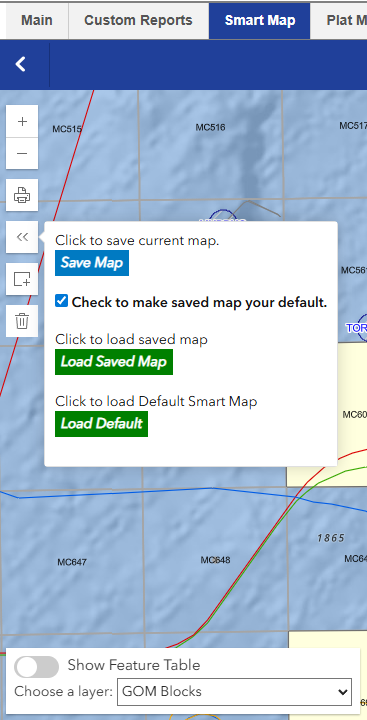
Save/Reset Map
- The next button on the left is the Save Map option. The first option is to save the map with the layers, colors, labels, and area currently loaded. If you wish to always open the map in this location, check the box below before clicking Save Map.
- You can always load your saved map by clicking the Load Saved Map button.
- The Load Default button resets all of the data in the map to the original set.
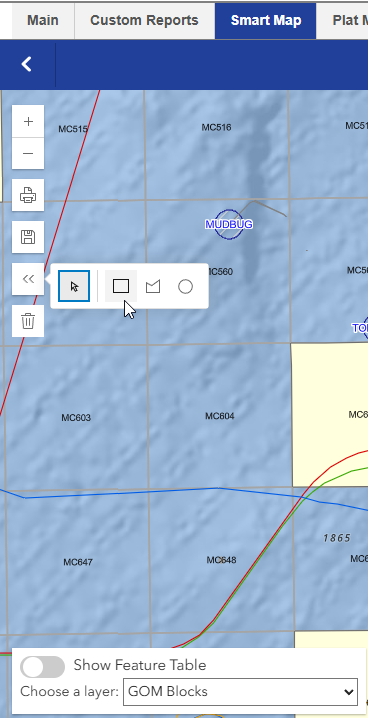
Select Features
- The next two buttons on the left handle selections in the map. First click the Select button and choose if you would like to select items in the map by drawing a rectangle, polygon or circle. Then click and draw the shape in the map.
- A list of layers will appear to choose which layer of data you would like your shape to select.
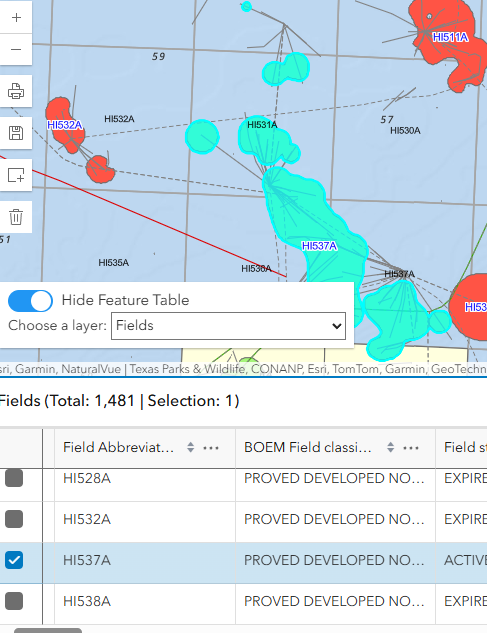
- Once selected, the features will appear cyan in the map.
- Those features can be seen in the table at the bottom of the map. From there, the selected records can be exported to a CSV file.
- Finally, the selection can be cleared by clicking the trash can icon.
View Tabular Data
- At the bottom left, tabular information can be viewed for any data in the map.
- Records can be selected in the table.
- With the three dot menu on the top right of the table, the map can be zoomed to the selection or the selected records can be exported.
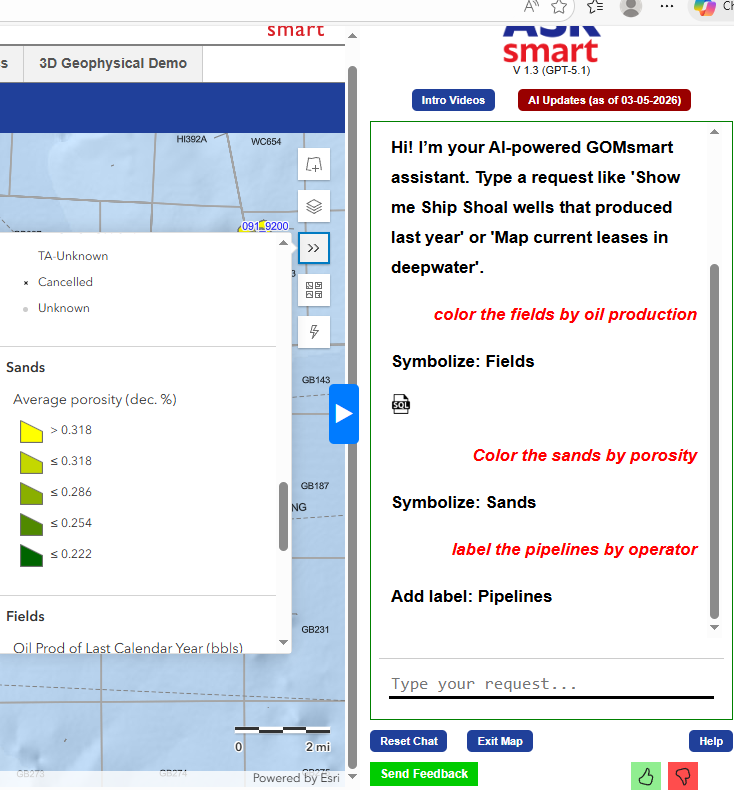
Controlling the map with AskSmart
The AskSmart panel on the right is the gateway to a wealth of functionality that may otherwise be tedious. With its AI chatbot simple prompts allow you to:
- Load/remove data
- Change colors (for all features or by attribute, such as color by oil production)
- Change labels
- Filter (query) data
- Zoom to a location
- Select features
- Control visibility
For more examples and details of using AskSmart for mapping, click here.