Analog Map
Overview
The Analog Map is an interactive map to display and graph details of wells that match specific input variables.
Map Controls
Zoom
The Zoom buttons control zooming in and out on the map. Zooming can also be done with the scroll wheel of the mouse. Look to the scale at the scale bar in the bottom left of the map.
Basemaps
The Basemap gallery allows different basemaps to be chosen for the map. These basemaps are most applicable offshore.
Measure Tool
The Measure tool displays the distance along a line. Click to activate the tool in the top left of the window, then click in the map for each point of a line. Be sure to clear the measurement when done.
Legend Popup
The Legend button display a quick popup of the symbology used in the map. This legend is also shown when flipping through the Table-of-Contents panel.
The Print tool creates an image or PDF of the map, with or without a full title block.


Table-of-Contents
Filter data
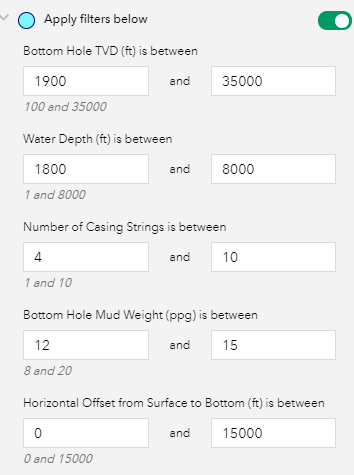
The data can be filtered by the values of the drilling projects. The filter is defined in the Filter Data panel and can be used to filter the projects by TVD, water depth, number of casing strings, bottom hole mud weight, horizontal offset (between surface and bottom hole location), percent of well drilled through salt and rig type.
Layers
Layers, such as blocks and protraction areas, can be turned off in the Layer List panel.
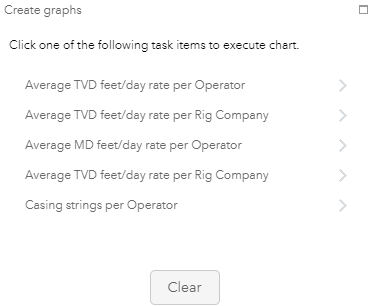
Graphs
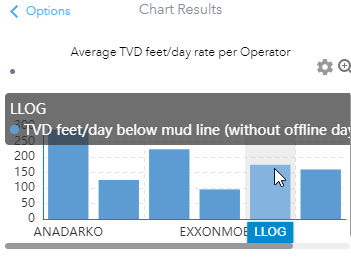
The Create Graphs panel list five possible graphs based on the drilling projects in the map: Average TVD/day per Operator, Average TVD/day per Rig Company, Average MD/day per Operator, Average MD/day per Rig Company and Average Number of Casing Strings per Operator.
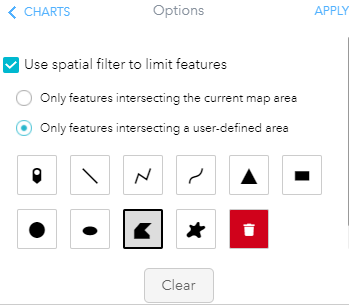
After choosing the type of graph, the map can be used to restrict the data used in the graph, either for the data within the map, or be interactively selecting certain projects within the map.
Hovering over or clicking a bar in the graph will highlight the projects in the map. The graph can also be expanded for legibility.
Map Interaction
Popup/Identify
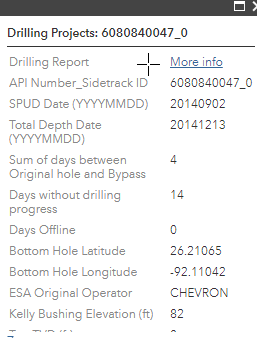
Clicking on a project within the map will display data specific to the project. Clicking the more info link next to Drilling Report will display a graph showing the drilling rate of the specific project.
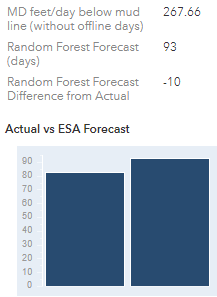
At the bottom of the window is a graph showing the actual drilling time and the ESA forecast drilling time.
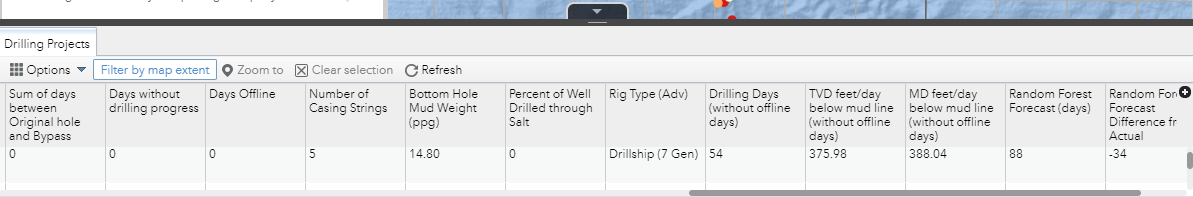
Table
At the bottom of the map is an arrow to click and show the tabular data of the Drilling Projects. It auto-filters to the extent of the map, and those used in a graph are automatically highlighted while the graph is open.