Depth vs. Days & Mud Weight Analysis
Overview
This section plots depth vs days drilled and depth vs mud weight for a series of wells in an area, combining drilling, mud weight, casing and paleo data.
Options
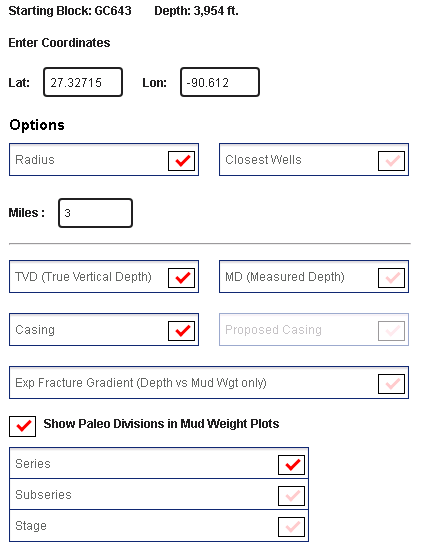
These include fields to customise the graph outputs.
Output
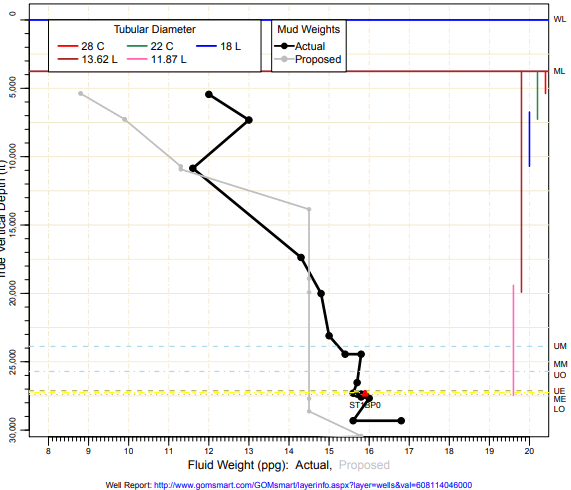
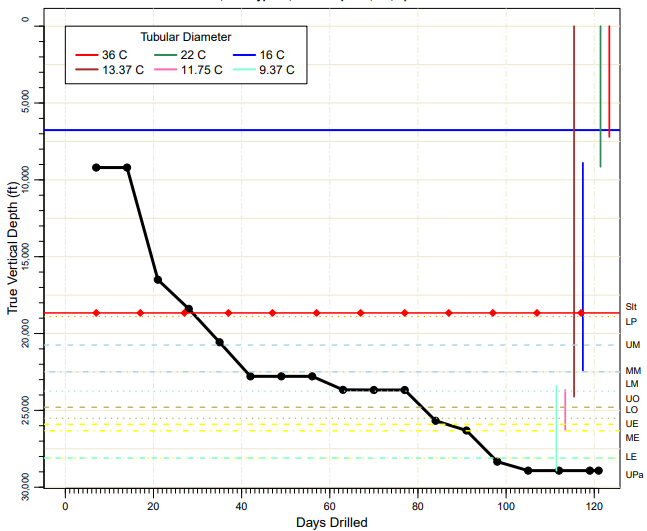
A series of graphs displaying depth vs. drilling time or depth vs. mud weight.
Overview
This tool takes Lat/Long coordinates and plots drilling graphs of depth vs days drilled or depth vs mud weight. The graphs are created by choosing the number of closest wells or wells within a certain distance. The resulting analysis provides visualizations of drilling data and mud weights and includes actual and proposed casing, expected fracture gradients and paleo divisions.
Options
From the entered coordinates, wells are gathered by selecting wells within a given radius or simply a number of closest wells. The default coordinates are the centerpoint of the block.
The y-axis of the graphs is the depth, with the option to plot with either True Vertical or Measured Depth.
Casing and proposed casing can be included in the graphs, though proposed casing is availabled only when measured depth is chosen. The Expected fractured gradient is an option on depth vs. mud weight graphs.
Paleo divisions can be plotted, showing either series, subseries or stage divisions. Special categories highlighting salt, Wilcox or Norphlet samples are displayed when appearing in the paleo reports.
Output
From the options above, robust graphs can be output to display depth vs. drilling time and depth vs. mud weight. Wells are queried geographically from the given coordinates and a series of graphs are saved to a PDF to view or download. In this way, many wells within a given area can be compared based on their drilling speeds, casing programs, mud weights and which horizons they penetrated.