AskSmart
Overview
AskSmart is an AI-powered assistant to help compile and analyze GOMsmart data by typing simple English questions or requests. It produces custom tables, charts and interactive maps...
Input
The interface is straightforward: Enter a question for AskSmart to answer. It will determine the best way to answer the question and ask for more...
Output
AskSmart generally answers in one of four ways: Directly answering a question conversationally, gathering data and presenting a table...
Overview
AskSmart is an AI-powered assistant to help compile and analyze GOMsmart data by typing simple English questions or requests. It produces custom tables, charts and interactive maps to meet your exact needs. AskSmart also generates text answers to questions or requests for specific analysis.
Type in a question or request. AskSmart may ask a clarifying question or two. It then accesses all GOMSmart tabular data, mapping data and hundreds of GOMsmart/BOEM/BSSE documents. It also has learned from access to scrubbed user support emails over the last 25 years.
Input
The interface is straightforward: Enter a question for AskSmart to answer. It will determine the best way to answer the question and ask for more information, if necessary. Each question can be built upon the last or evaluated as a new question. For example:
- How many wells were drilled in the Lucius field?
- Tell me about Shazam
- When is the next lease sale?
- Give me a production chart on the EI330 field.
- Which leases did BP bid on end the last 10 years?
- Can production be added to this table?
- I would like well logs in AC025.
- Make a map of Chevron leases.

Output
Depending on your question or request, AskSmart answers by either creating:
- A table, with the ability to add or delete columns and sort as you decide. It can also download a .csv.
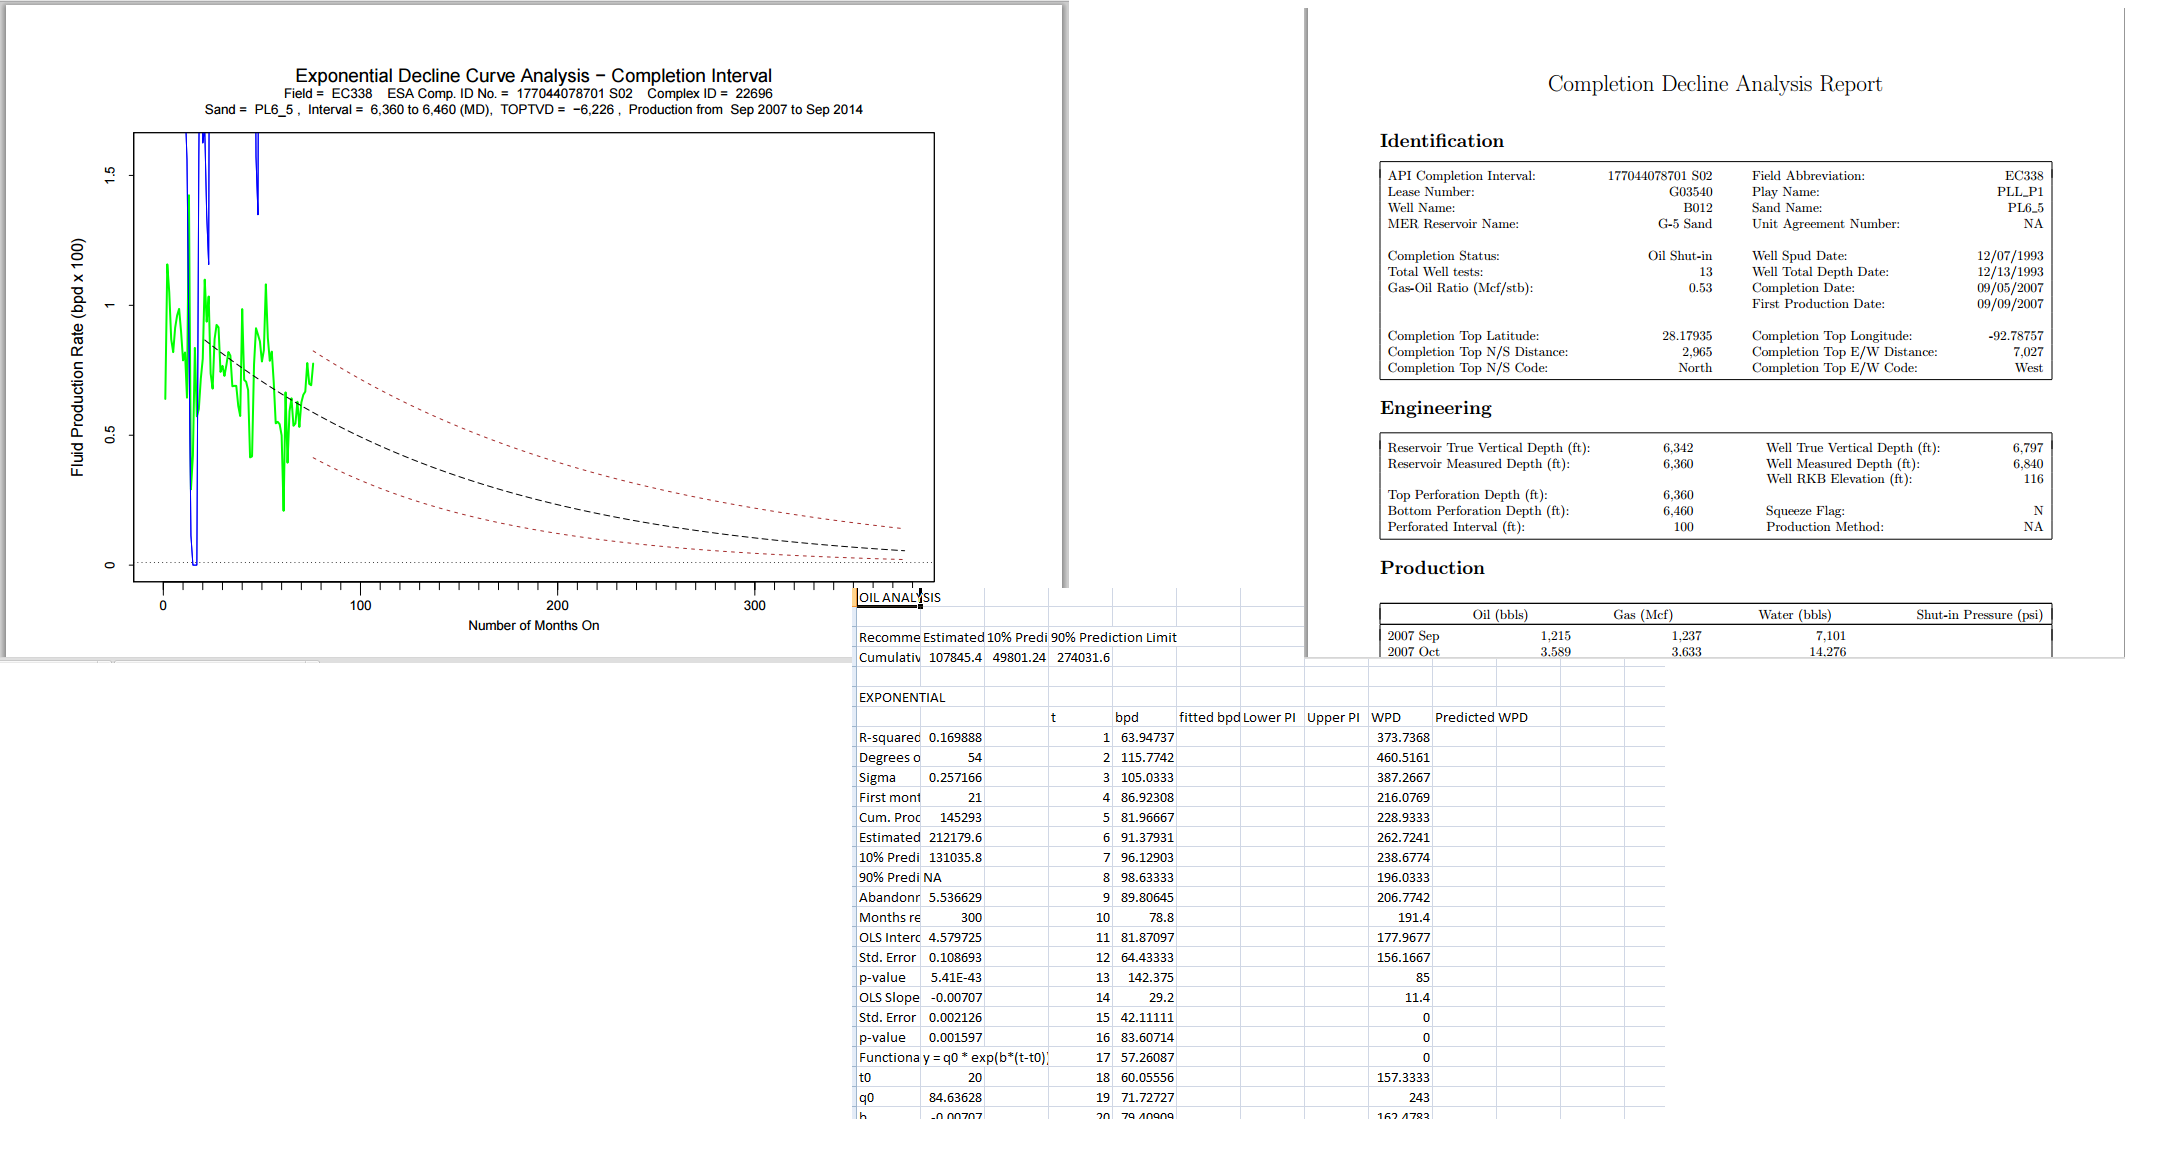
- A chart, either calling from the GOMSmart chart library or creating custom chart to meet your requirements. Save it as a pdf or other image format.
- A text response, composed by its AI engine, that synthesizes numerical data and finds the explanation or solution you’re looking for. Create a pdf or copy it to your clipboard.
- An interactive 2D map, responding to your specifications of variables and their legends, definition queries and labeling. After AskSmart returns an initial map, you can interactively change its elements and style. Clicking with our hot link tool exposes our data and analytic resources of that element. When you done, create a pdf or other image format or save it for directly for input to ArcGIS Pro. See details of the Smart Map here.
- An interactive 3D map of most of the oil and gas fields in the Gulf. Each includes 3D models of sands, wells, completions, choice of well logs down the well bores, paleo observations and surfaces. In a major new addition, our 3D field maps draw from our library of >500 3D slice-able seismic amplitude and velocity surveys. To access later or share with other GOMSmart users, the URL is provided.
- A direct link to GOMSmart analytic tools. Need to know ESA’s real-time platform and aggregate forecasts for production losses from a hurricane entering the Gulf? You’ll get maps and tables immediately.