GOM3 Charts
Production charts are available for Wells, Completions, Fields, Pools, Sands, Blocks, Leases and Platforms. All production data released by the BOEM is included in GOM3. The data, which is monthly production data for each completion from the 1940s on, is aggregated to the well, to the sand, to the block, etc. Production data is aggregated to the platform based on the wells drilled from the platform or those wells tied back to it.
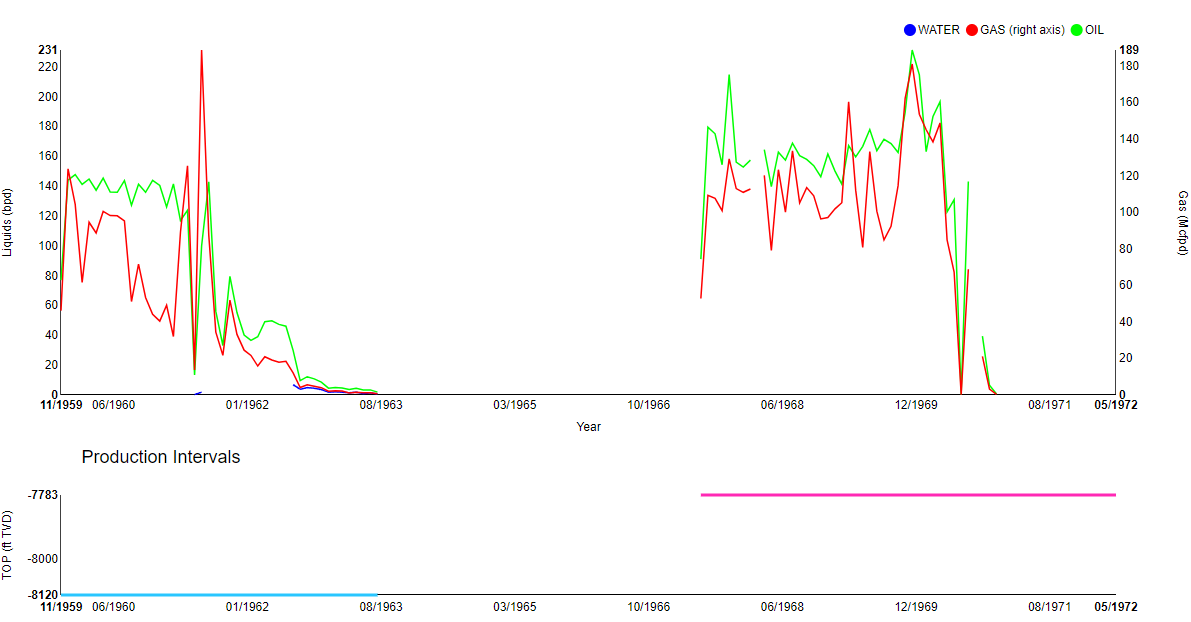
Production graphs are shown in either monthly or daily production, with linear or log scales and shown by date, by number of months producing or by cumulative production.
All production charts have a secondary chart that varies by dataset (secondary charts are not loaded on mobile devices). For example, the secondary charts for field production show an area plot of production per sand, while the secondary graph for wells displays which completion produced over time.
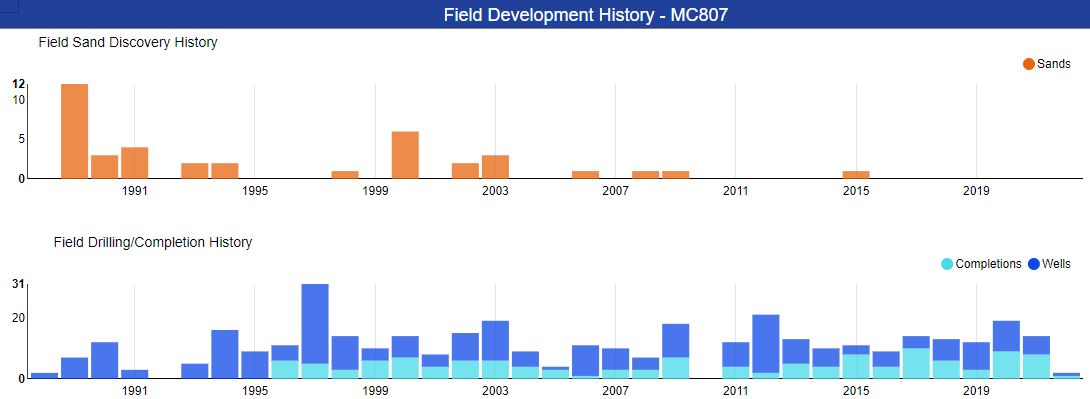
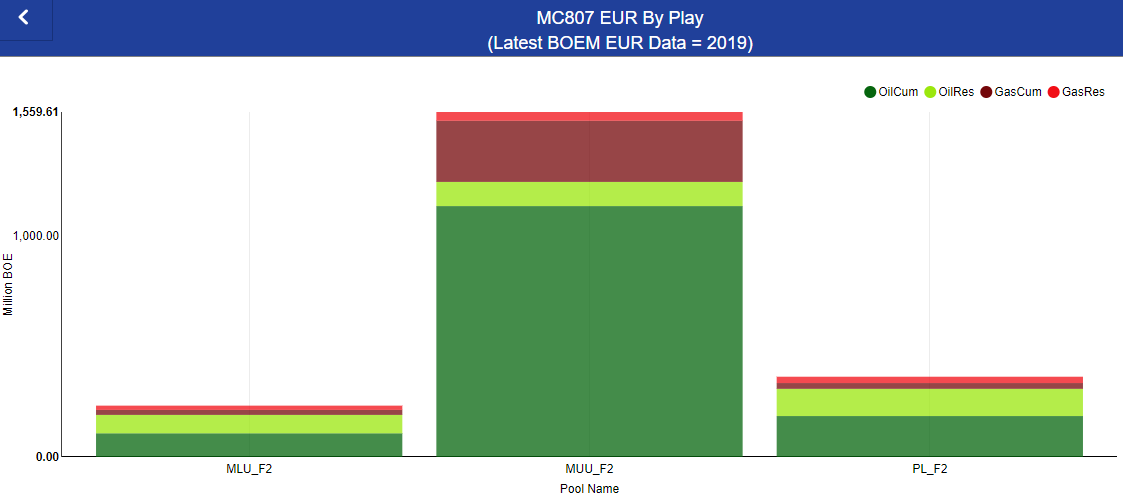
There are two other charts that apply only to fields. First is the Development History chart, which shows both sand discoveries and new wells and completions (below). And second is the Estimated Ultimate Recovery by Play (bottom).