GOM3 Decline Curve Analysis
Decline Curve Analysis is only available for Completions (with the exception of decline curve analysis for each reservoir in the GOM3 Analytics Addon). It runs decline curve analysis with the three standard models (exponential, cumulative, hyperbolic) for oil and gas, with p/z for gas when test data is appropriate.
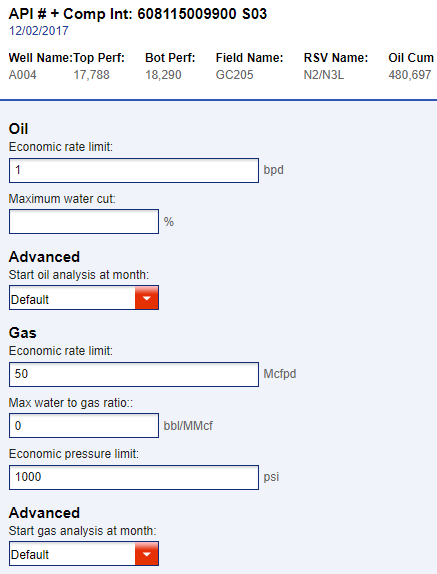
Many inputs are available to adjust the analysis for the chosen completion, including economic production rates, oil/water and gas/water cuts, pressure limits for p/z, and dates to begin the analysis. The default date is chosen from an analysis of the production data to find the last "structural break in the regime," essentially locating the last significant peak in production and running the analysis from that point.
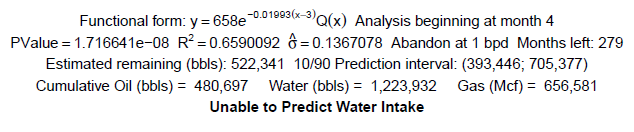
Outputs consist of three choices: Charts displaying output of all models, a report similar to the regular Completion reports, but with the addition of the graph of the best model, and a CSV file of all of the forecast data. All three outputs include all statistics including remaining oil and gas, r2, p-value and even the functional form.
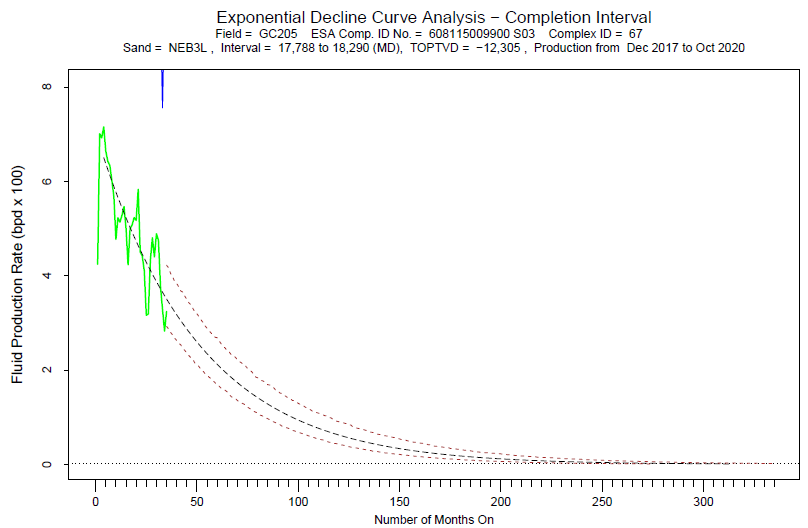
The bottom image shows the graph of the exponential decline model for oil in a completion in the Genesis field. The full PDF can be downloaded as an example here.