Forgotten Oil and Gas
Overview
The Forgotten Oil and Gas Study uses various methods to compile prospective locations where hydrocarbons where previously identified but not produced....
Decline Curves
The decline curve data set lists the estimated remaining resources for every reservoir in the Gulf of Mexico.
Dead but Not Declining
A number of older reservoirs were found that had not yet entered into a state of decline but have not produced for many years....
High Test Rates
Many completions were identified that had high test rates but never produced...
Field and Sand Reserves
Fields and sands were identified where the current estimated ultimate recovery is significantly less than in the past...
Overview
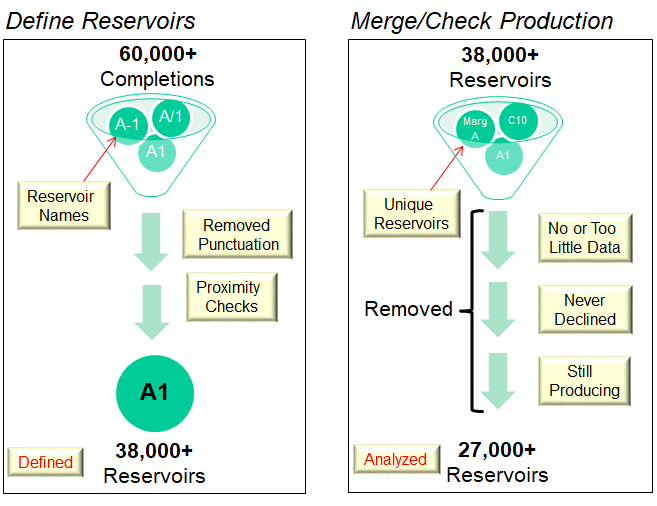
The Forgotten Oil and Gas Study uses various methods to compile prospective locations where hydrocarbons where previously identified but not produced. The study generated over 2,000 significant leads – all within the bounds of producing or abandoned fields in the Gulf. The results of the analysis are given in tabular form and as mappable objects in a GIS. In the end, the data can be used in various ways: identifying reserves on currently held leases, farming in to existing leases or acquiring new leases through bidding. In all cases, the expectation is that the data in the Forgotten Oil and Gas Study can be used to focus resources on areas that have already been investigated, lowering risk and improving efficiency. While all of the datasets highlight the location of anomalies among fields, sands and completions, the lion's share of the analysis was the batch decline curve analysis on every reservoir in the Gulf. This process first needed to clean the non-standardized name given by operators to properly assign each completion to the proper reservoir, then attempt to verify it spatially in three dimensions. After defining the reservoirs that stopped producing over two years ago (because of possible incomplete data in the past two years) the reservoirs were filtered to the large set in this study.
Decline Curves
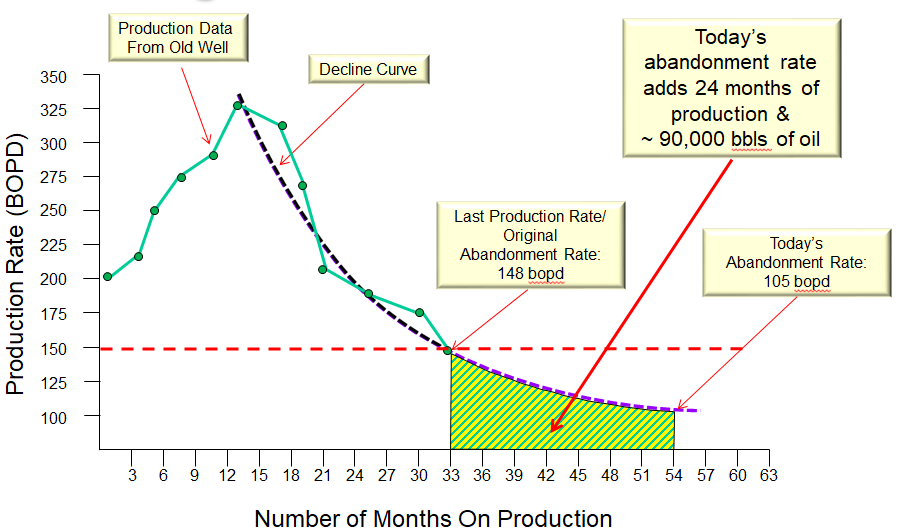
The analysis utilizes the following inputs prior to the results: The decline curve data set lists the estimated remaining resources for every reservoir in the Gulf of Mexico. The remaining resources were estimated by three decline curve functions and the estimate from the curve with the best fit is reported. The average abandonment rate in the reservoir’s water depth, TVD and gas-oil ratio cohort was used for this analysis. The difference between this average and the old abandonment rate is how old reservoirs can have significant remaining resource. Along with the remaining resource estimates, statistics on the estimate confidence, the location, date of production, and current ownership are also listed.
Dead but Not Declining
A number of older reservoirs were found that had not yet entered into a state of decline but have not produced for many years. As such, decline curve analysis could not be utilized to estimate remaining resources but some of these reservoirs still appear to be valuable. The last known rates of production are given with some over 1,000 bbls/day.
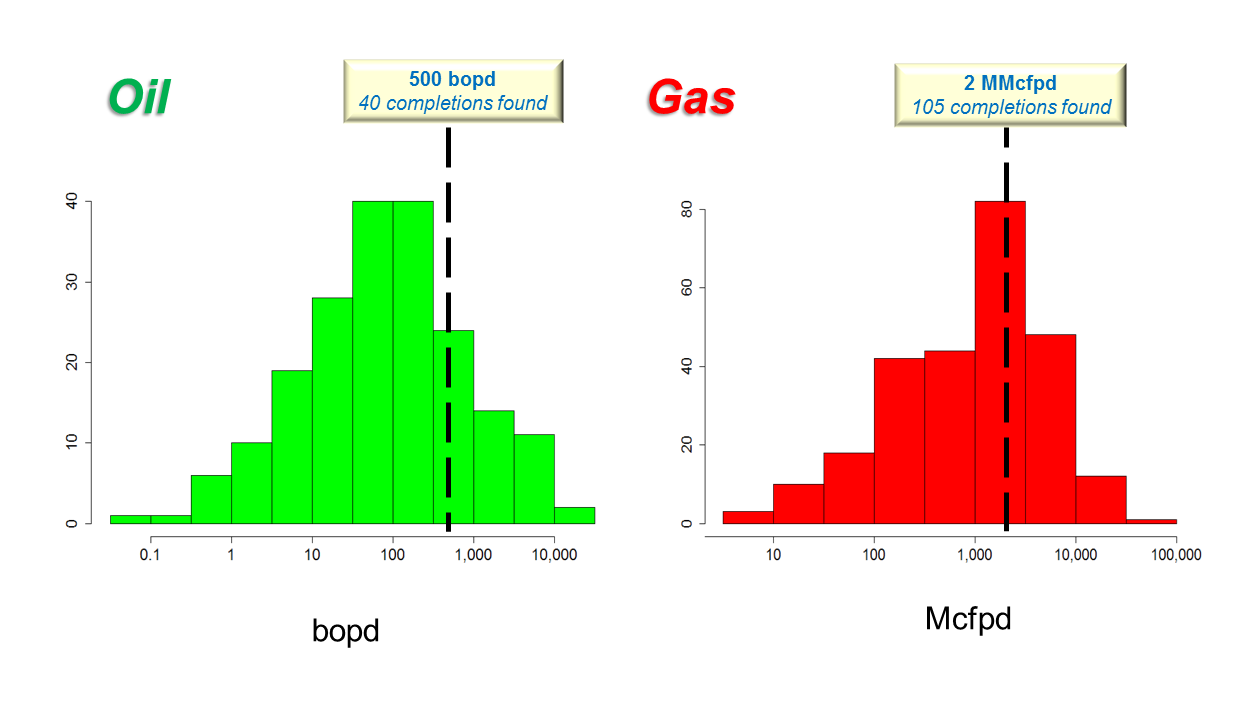
High Test Rates
Many completions were identified that had high test rates but never produced. These completions were segregated to ensure that a subsequent completion in the same interval didn't account for the production.
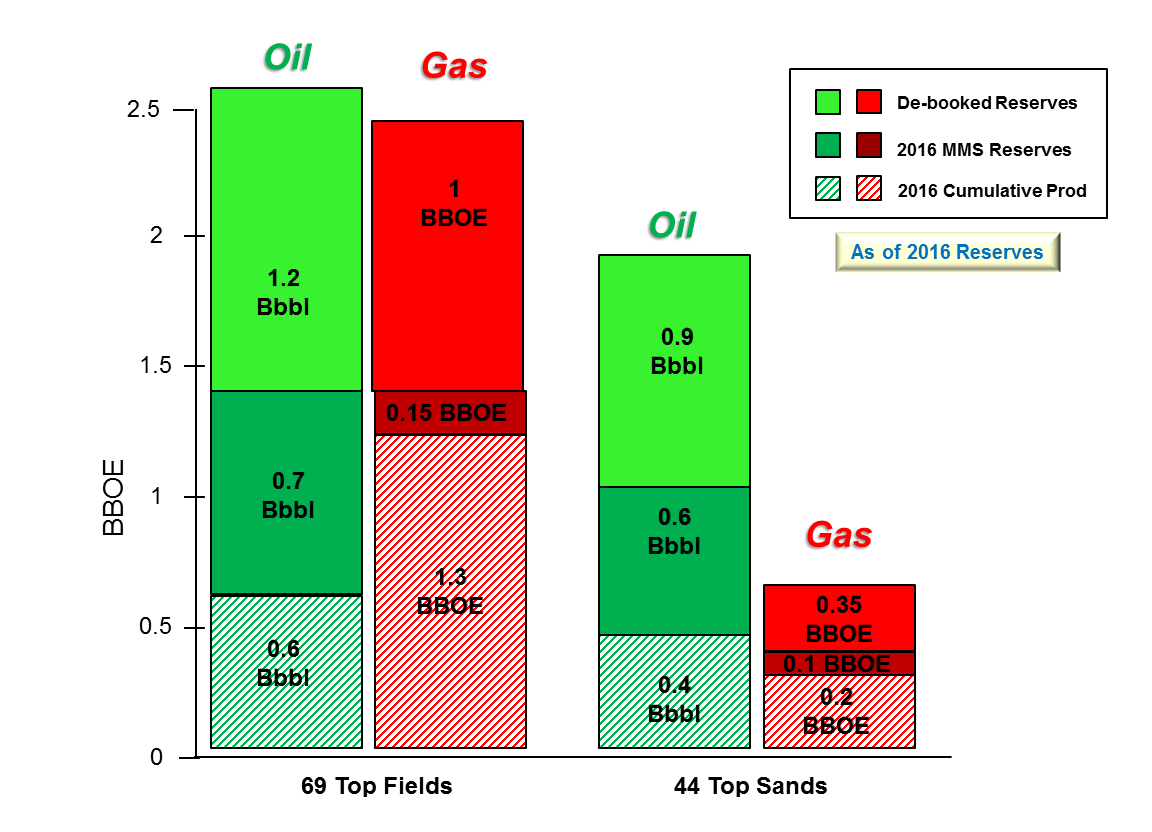
Field and Sand Reserves
Fields and sands were identified where the current estimated ultimate recovery is significantly less than in the past. Typically reserve estimates grow as more resources are discovered over time so sudden downward shifts may indicate the resources were removed from the books for non-technical reasons (i.e. the resources are still recoverable). There are valid reasons resources may be removed from field/sand reserve estimates (bad initial estimates, technical reasons making some of the resources unrecoverable, changing which fields the resources are assigned, typos) and validity checks were performed to limit these to fields with unexplained reserve estimates