Well Log Viewer
Overview
The ESA well log viewer displays Geologic & Geophysical (G&G), mud, or mechanical data through an online viewer.
Input
The well log viewer can be accessed through the ESA Analytics page from GOMsmart.
Output
The well log viewer creates dynamic and interactive web-based graphs for Geologic & Geophysical (G&G), mud, or mechanical data
3D Well Logs
The data is also available in 3D through ArcGIS Pro.
Overview
The ESA well log viewer displays Geologic & Geophysical (G&G), mud, or mechanical data through an online viewer. These three log types display standard curves based on expert consensus and the data is mined from all publicly available LAS files. In cases where a single well has multiple LAS files, the data is combined so every well has one well log view (for each of the three log types) through the ESA well log viewer. Additional context (paleo, hydrocarbon bearing zones, geomarkers, and completion intervals) has been added to provide as much information as possible.
For details on the curation of the 'Golden Set' of logs viewed online, click here.
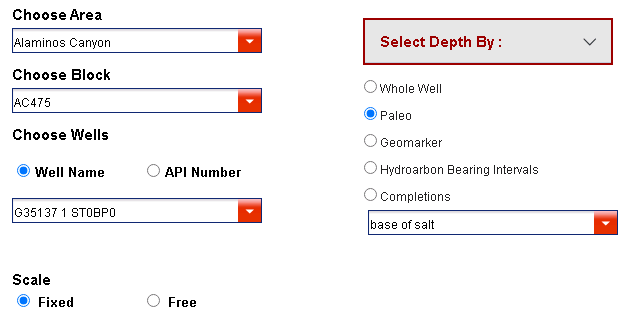
Input
The well log viewer can be accessed through the ESA Analytics page from GOMsmart. From here wells can be selected by drilling down through protraction areas and blocks. Well logs can be viewed for the entire well or zoomed in to completions, paleo picks, hydrocarbon bearing zones, or geomarkers. The fixed option has standard axis limits set regardless of the data and the free option will scale the axis so the data fills the plotting area.
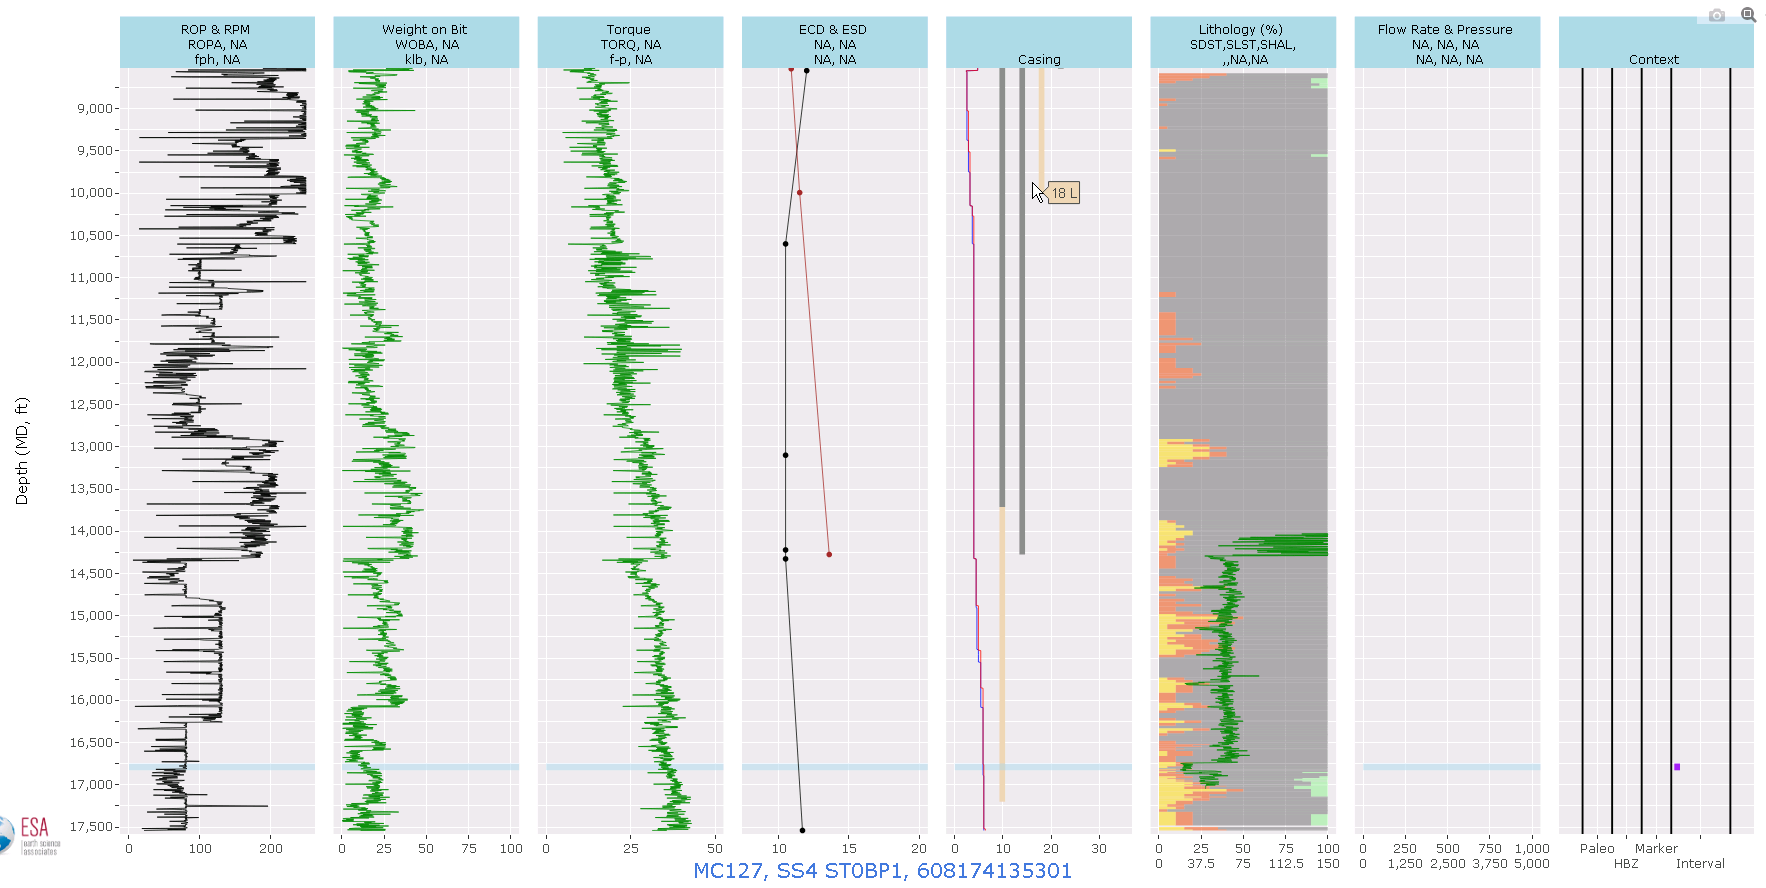
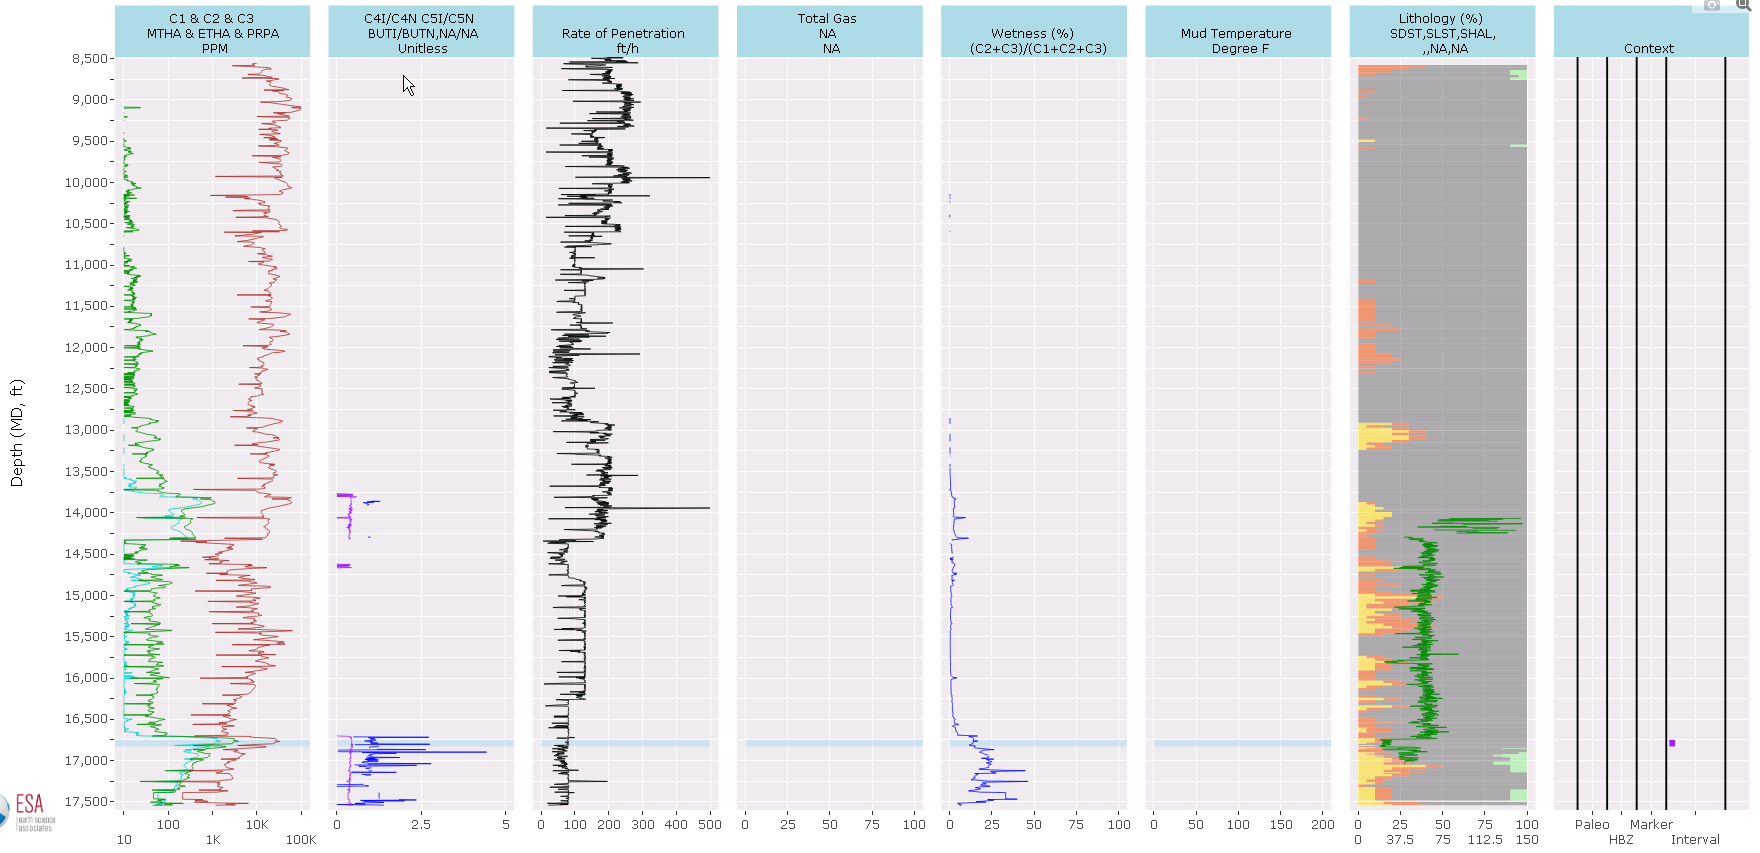
Output
The G&G log displays gamma, caliper, resistivity, neutron, bulk density, sonic, spontaneous potential, and lithology. The mud log displays C1, C2, C3, C4 Iso / C4 Normal, C5 Iso / C5 Normal, rate of penetration, total gas, derived wetness, mud temperature, and lithology. The mechanical log displays rate of penetration, RPM, weight on bit (surface and downhole), torque (surface and downhole), ECD, ESD, mud in weight, mud out weight, lithology, annular pressure, pump pressure, and flow rate. The mechanical log has additional casing data and mud weight data from the weekly activity reports. Click and drag to zoom (it is recommended you drag vertically) and double click to go back to the full extent.
 Mud Log
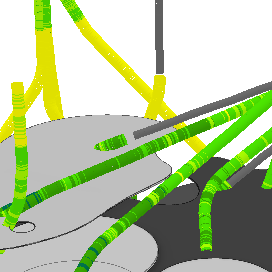
3D Well Logs
The data is also available in 3D through ArcGIS Pro. To load the data click the GOM3 3D data button in the GOM3 ribbon, then check the Well Logs box to have it display in any of ESA's field views. This loads a list of curves available to map in 3D, with the same level of customization of symbols and layers as all other GIS data. The hotlink tool and hyperlinks in the ID window provide links to the ESA well log viewer, either for the entire well or a zoomed in view around the clicked segment of the well.